Stop guessing.
Start knowing.
Your WiFi, finally transparent. Real-time monitoring, AI-powered predictions and ISP throttling detection, all in one free app for Windows.
- 100% free
- No installation
- Your data stays on your PC
- v2.0.0: now with ML.NET forecasts
Sound familiar?
Three questions every home WiFi owner asks. Without data, every answer is a guess.
Why is my WiFi so slow?
You pay for fast internet, but the connection feels sluggish. Is it the router? The ISP? The neighbours? You have no idea.
Is my ISP throttling me?
Netflix buffers at peak hours. Downloads crawl at night. You suspect throttling, but you have no proof.
When should I download this?
That 50 GB game update. Start it now or wait? You are flying blind and hoping for the best.
You deserve answers, not guesswork.
Everything you need to master your WiFi.
Six tools in one small app. Each one starts working the minute you open it.
Real-time monitoring
Never wonder about your WiFi status again.
- Live signal strength tracking
- Upload and download speed monitoring
- One health score from 0 to 100
- Automatic updates every 30 seconds
- Network details: SSID, band, channel, security
AI-powered predictions
Stop reacting. Start preventing.
- Hybrid ML.NET and statistical engine
- Signal drop forecasts, 6 minutes ahead
- Slowdown and congestion warnings
Speed testing
Know your real speeds, not advertised ones.
- Ookla Speedtest CLI built in
- Automatic hourly tests
- Download, upload, latency and ISP
Historical analytics
Turn data into decisions.
- ISP throttling detection
- Best download times, hour by hour
- Stability score over 24 hours
Device tracking
See who is on your network, always.
- Automatic network device scanning
- Maker identification for 20+ brands
- New device alerts
- Device type detection
- Trust management for known devices
Smart alerts
Recommendations, not just raw data.
- Weak signal warnings
- 5 GHz upgrade tips
- Channel optimisation
- Security recommendations
- Predicted issue warnings
Weak signal warning
5 GHz upgrade recommendation
Channel optimisation suggestion
Security: your network uses WPA2
Network congestion expected during this hour
See it in action.
A simple interface with deep insights. Scroll through the four screens you will use most.
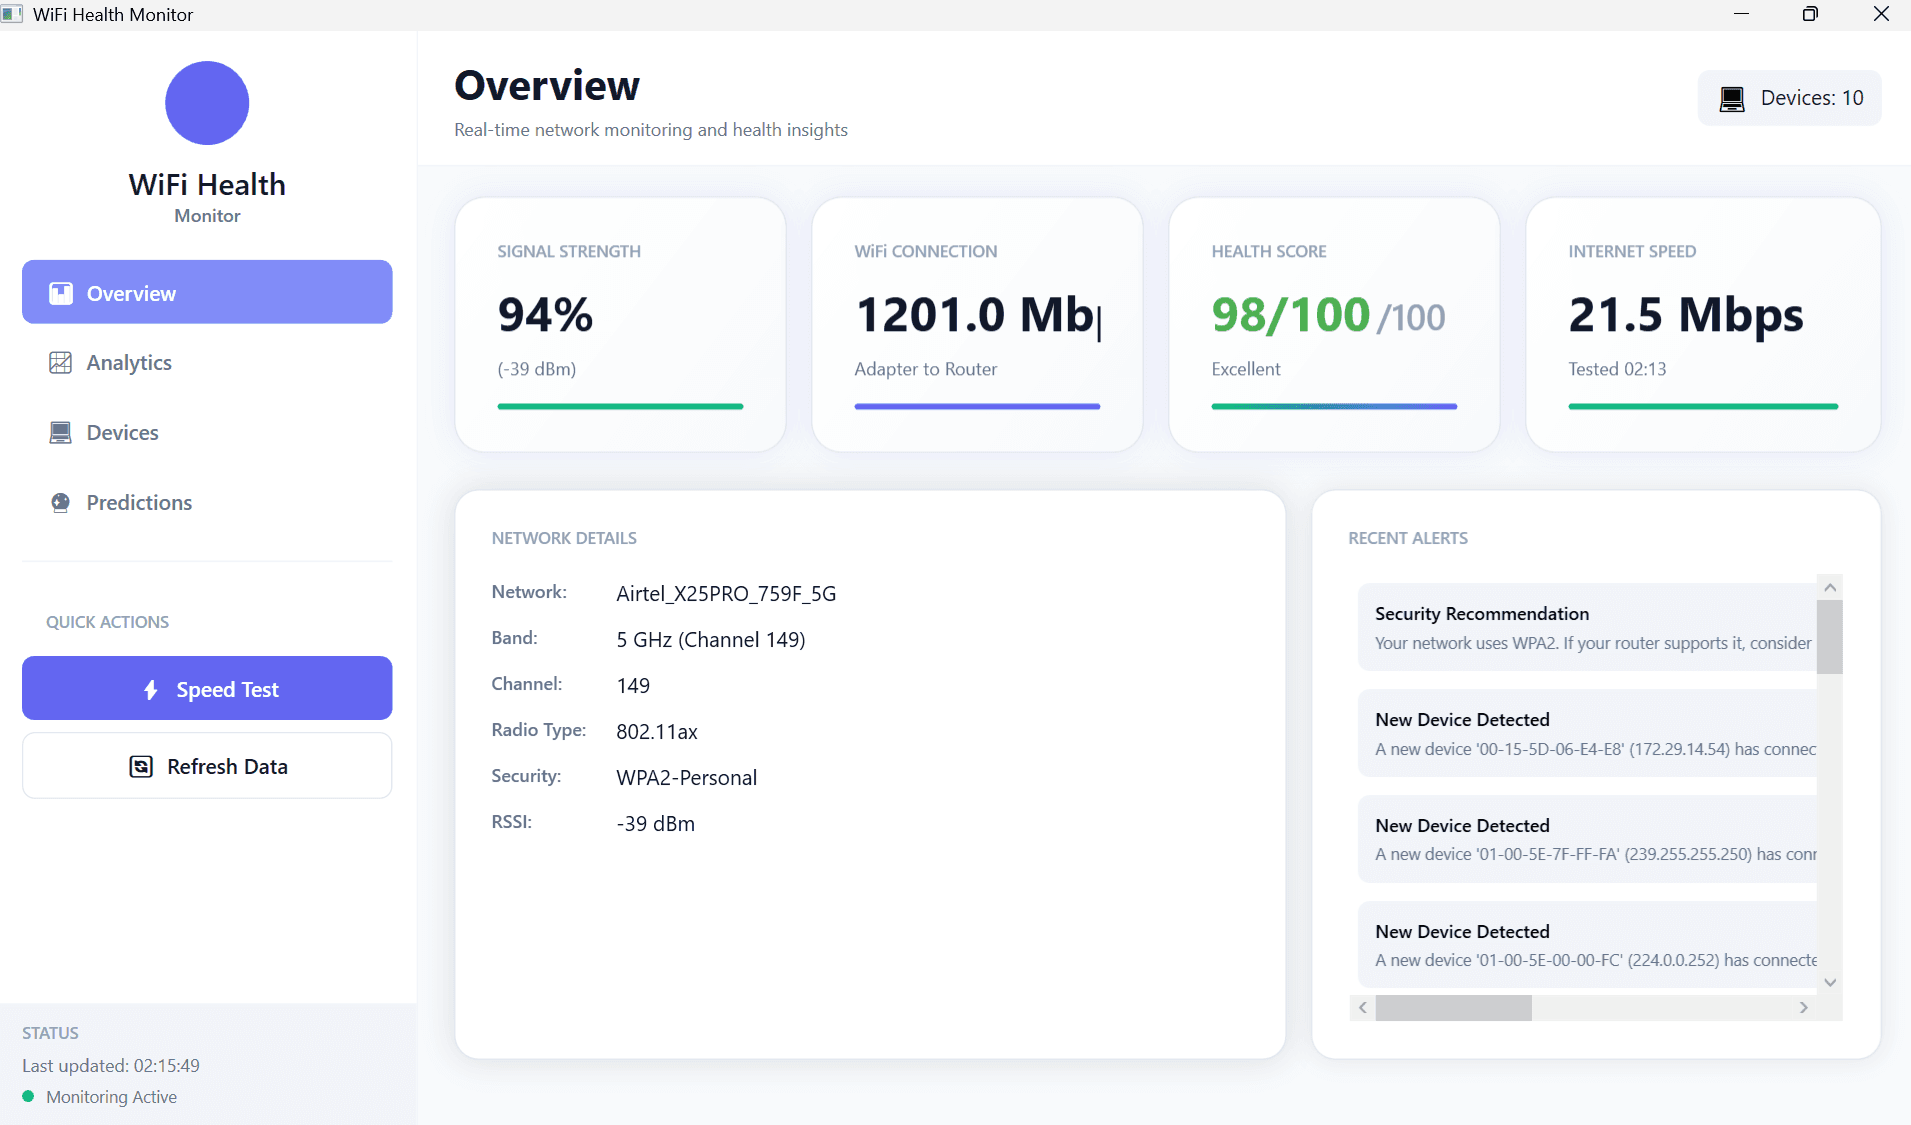
Overview: Your whole network on one screen.
- Current signal strength and connection speed
- Health score with colour-coded status
- Network details and security info
- Recent alerts and recommendations
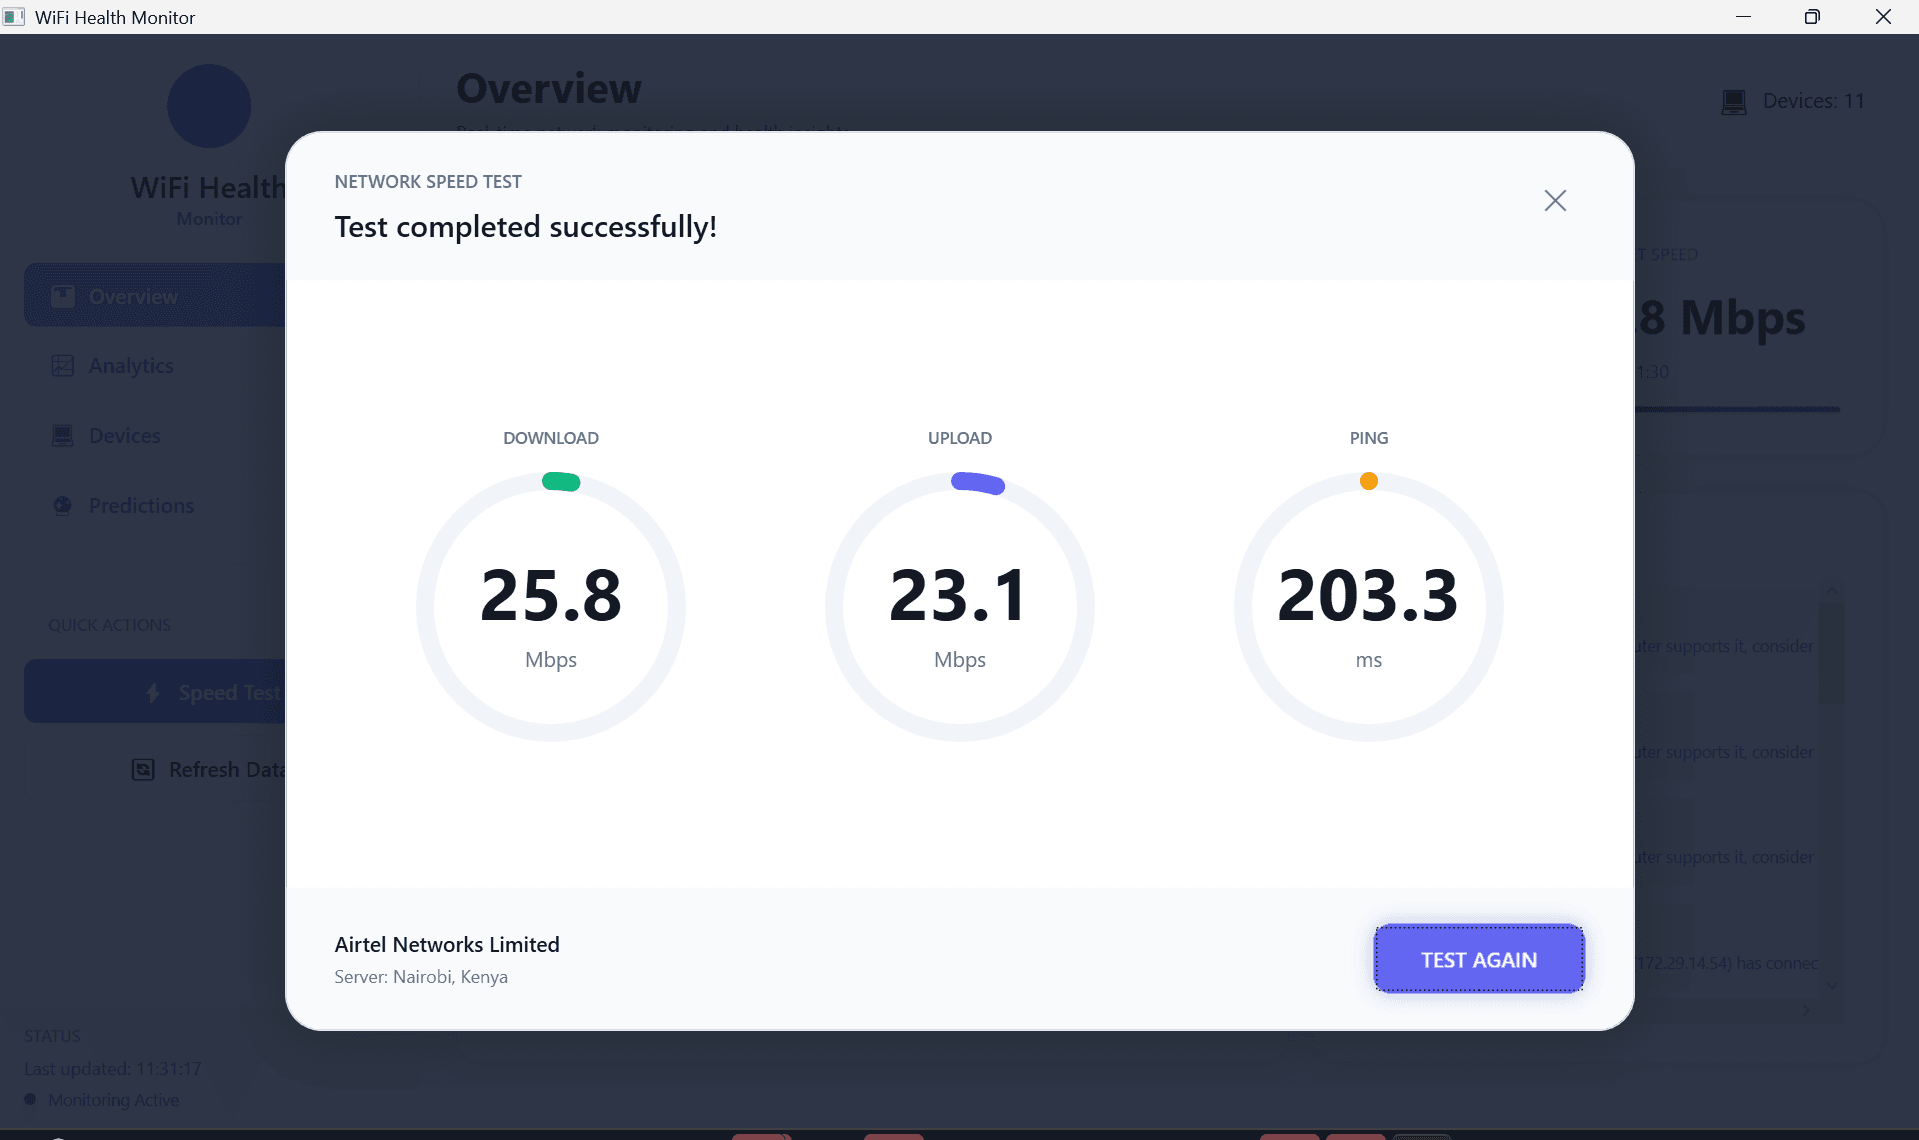
Speed test: Real speeds, measured by Ookla.
- Download, upload and ping in one run
- Runs every hour, or when you click
- Your ISP and test server in every result
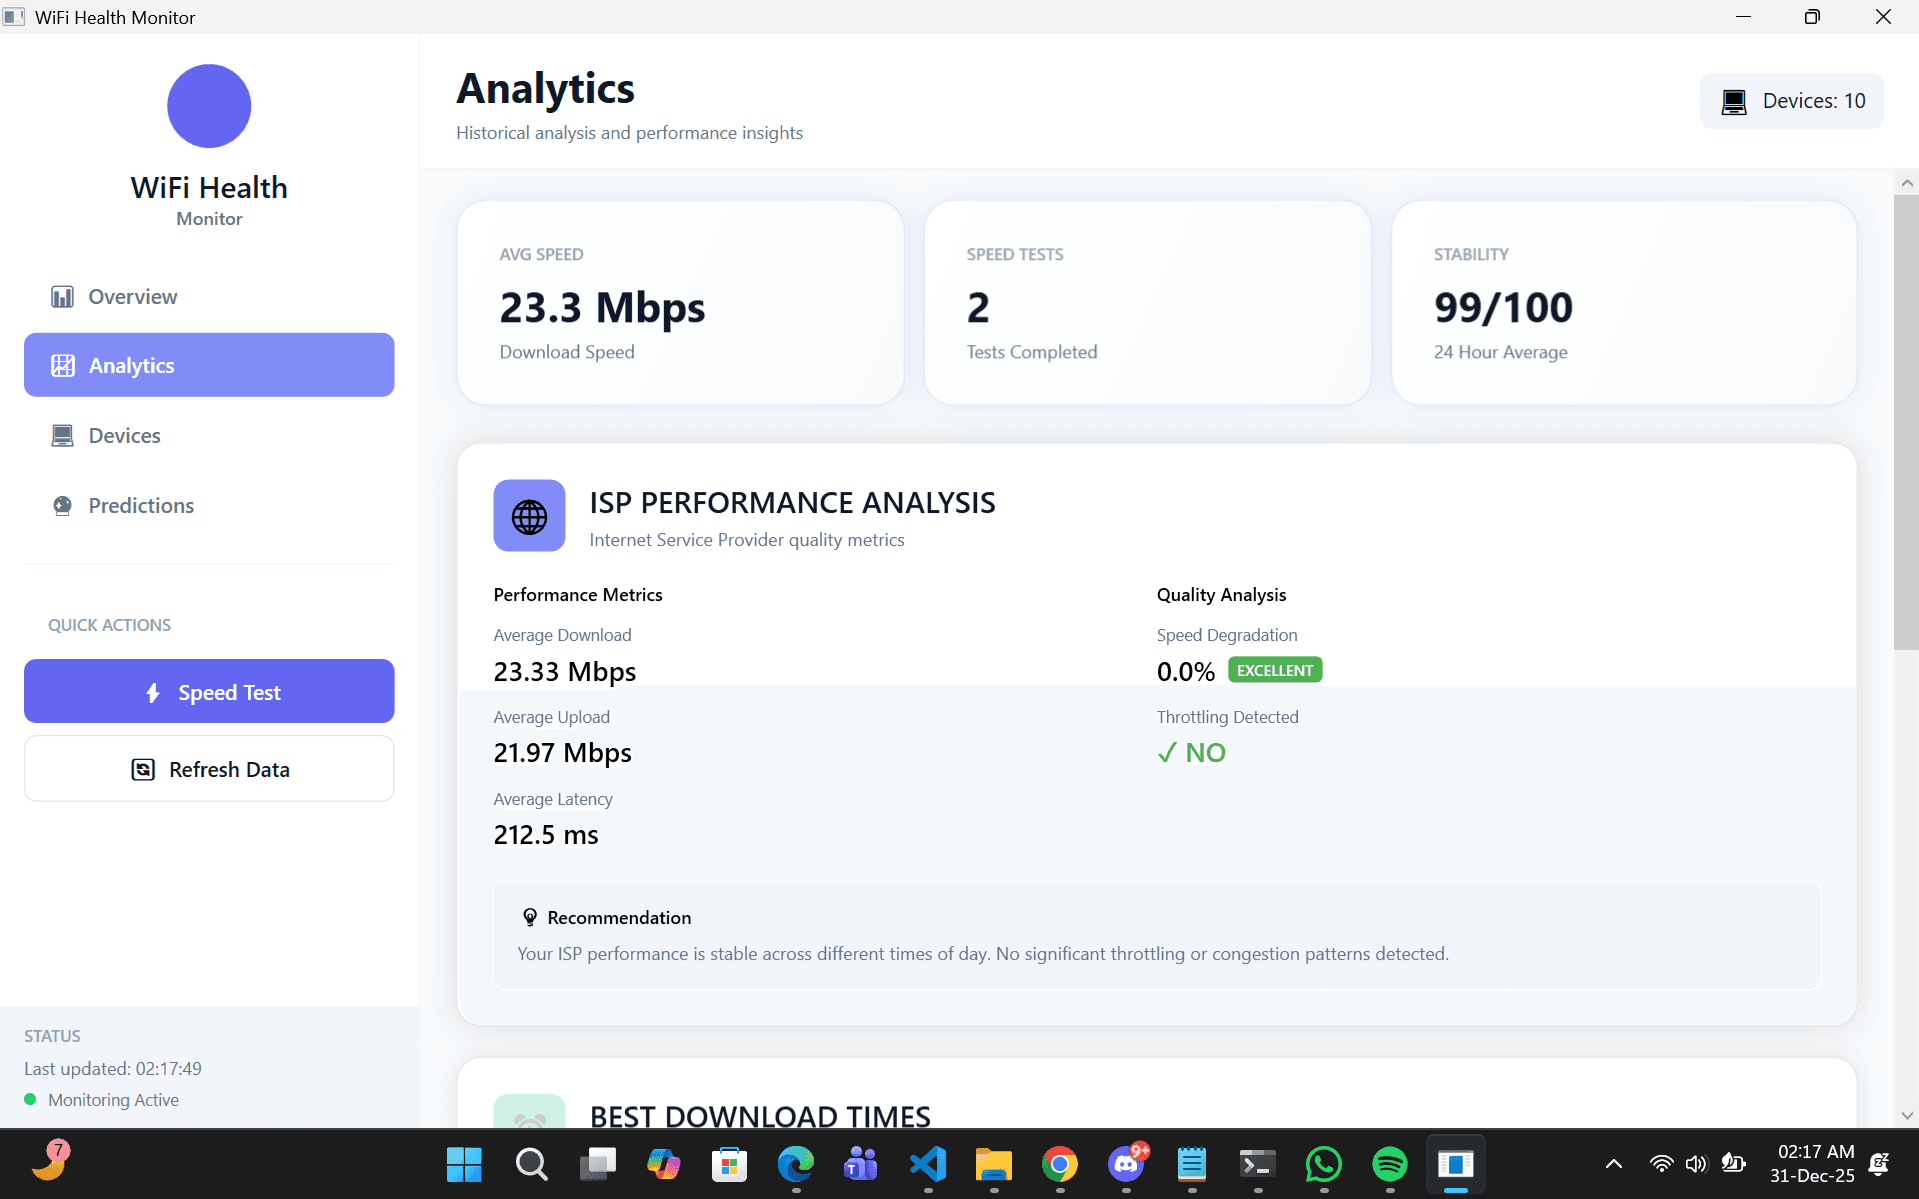
Analytics: Proof, when your ISP slows you down.
- ISP throttling detection with proof
- Best and worst hours for downloads
- 24-hour network stability metrics
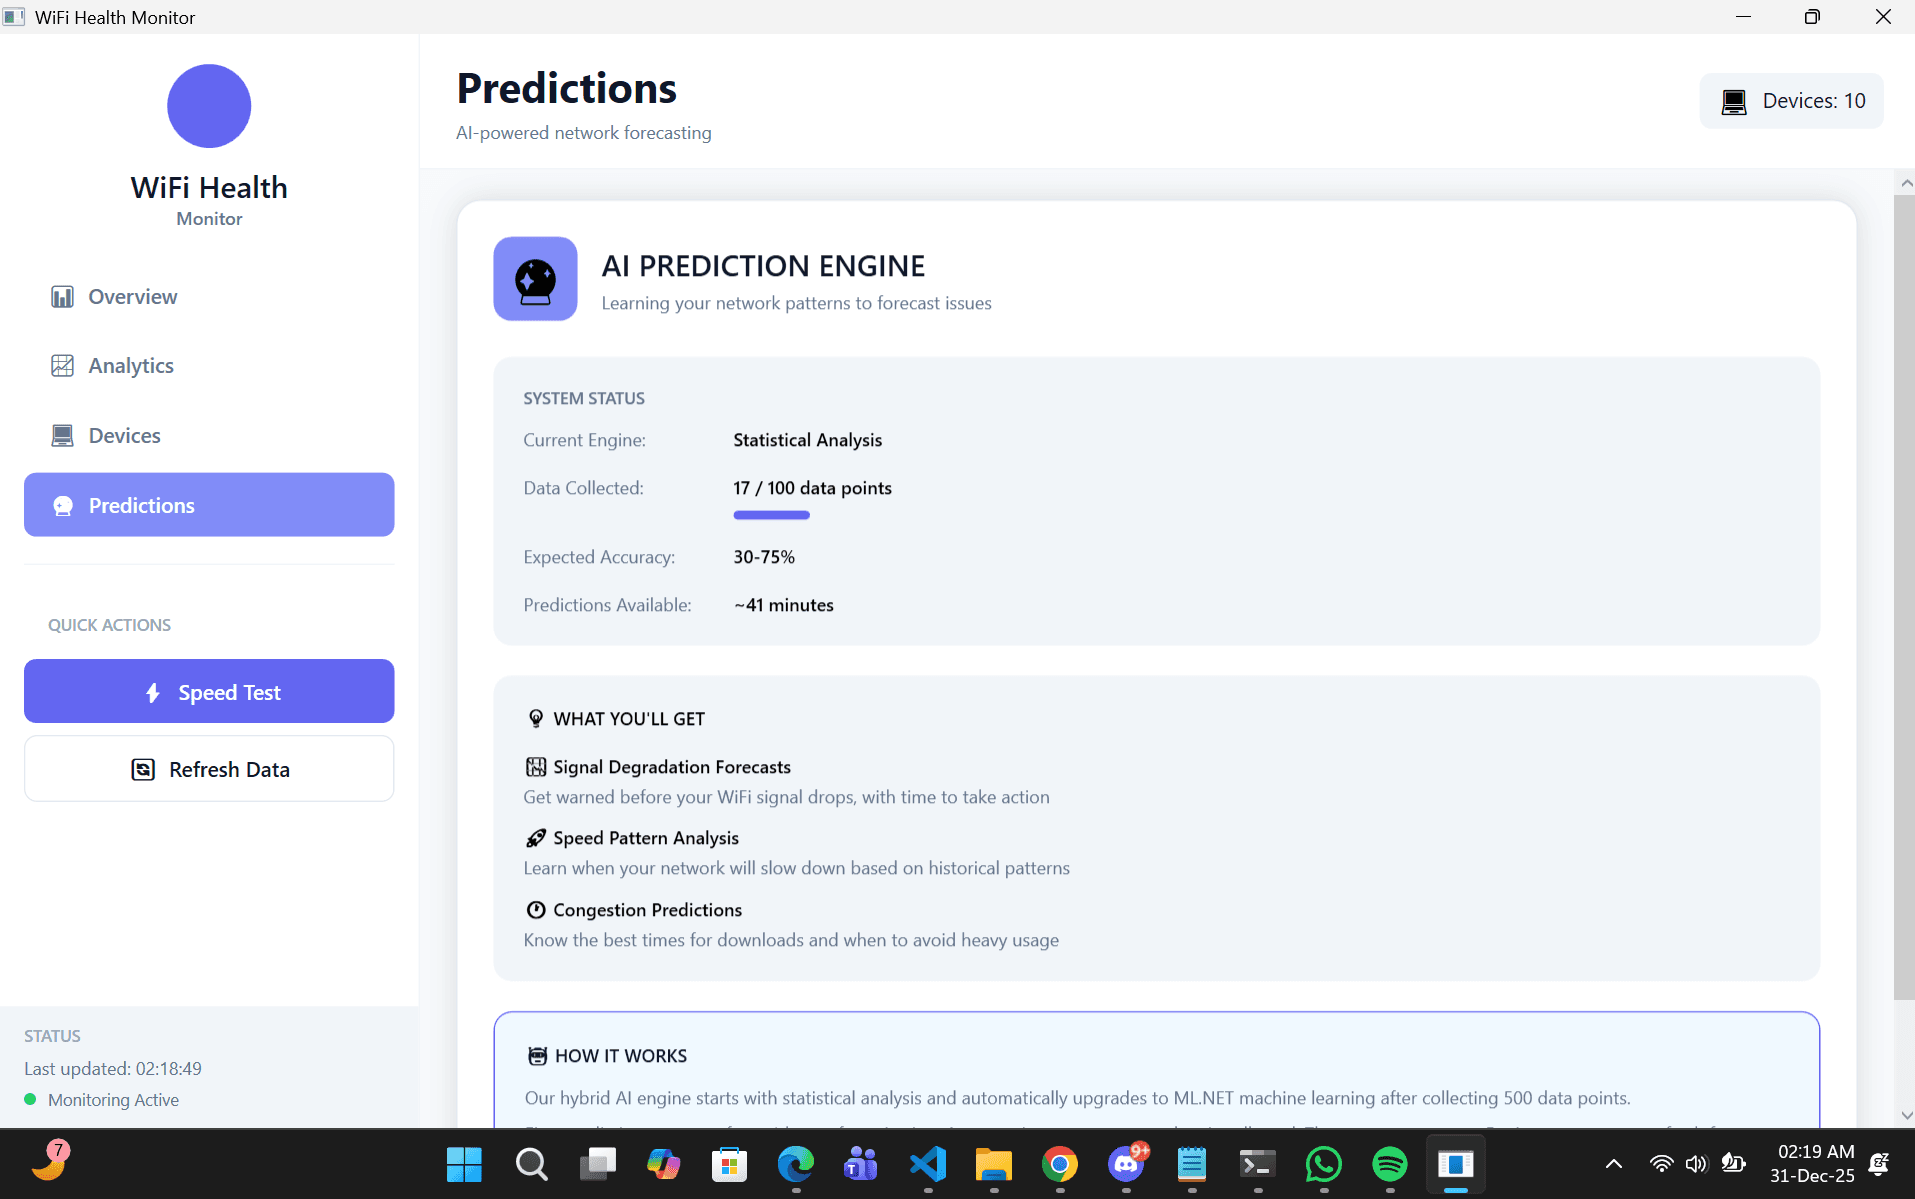
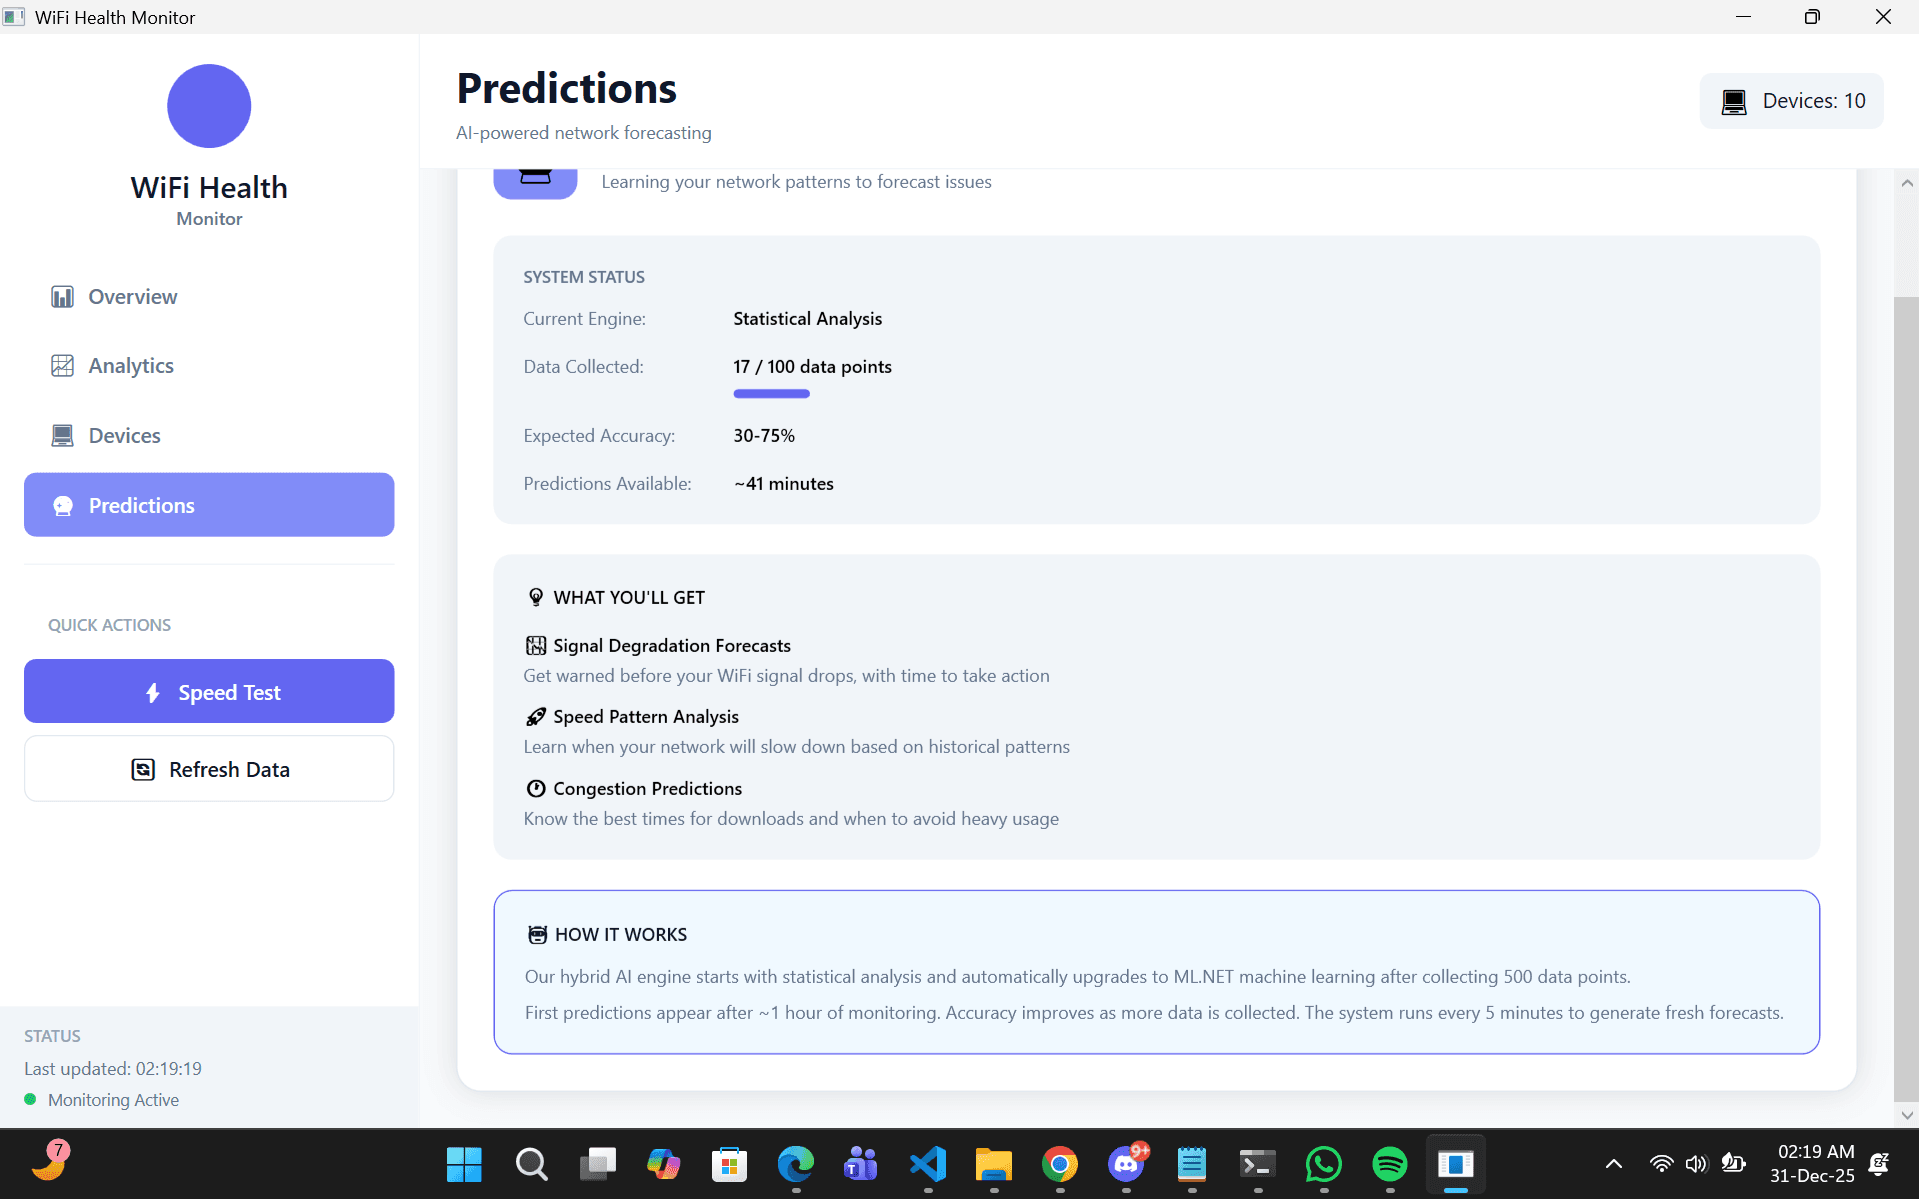
Predictions: A forecast for your connection.
- Signal degradation forecasts
- Speed slowdown warnings
- Current engine and data collected
- Expected accuracy, stated up front
Not just monitoring. Predicting.
The hybrid engine does not only tell you what is happening. It tells you what is about to happen.
Statistical analysis
Phase 1 · From the first minute
- Works at once, with little data
- Linear regression for signal trends
- Pattern detection for speed changes
You get value on day one while the ML model trains.
Measured accuracy30–75% Machine learning
Phase 2 · After 500 readings, about a week
- Automatic upgrade to ML.NET forecasting
- Singular Spectrum Analysis (SSA)
- 12 steps ahead, which is 6 minutes
It learns the patterns of your own network.
Measured accuracy60–85%
Real predictions you will see
Signal degradation predicted. Currently 72%, will reach 48% in 6 minutes.
Speed typically drops 35% around 8 PM based on historical patterns.
Network congestion expected during this hour.
Your data.
Your machine.
Period.
We built this app because we wanted WiFi insights for ourselves, not because we wanted your data. Every reading lives in one SQLite file on your own PC:
%APPDATA%\WiFiHealthMonitor\
- 100% local processing
- All data stays on your computer. Zero cloud uploads.
- No account
- No sign-up, no email, no personal information.
- No telemetry
- The app does not track you, phone home or send analytics.
- Works offline
- Monitoring needs no internet. Only speed tests do.
- Data you can open
- One SQLite database in your AppData folder. You own it.
- Open source
- The code is on GitHub. See exactly what the app does.
Simple setup. Powerful insights. In under 60 seconds.
No installer, no account, no settings to learn.
- 1
Download
Get the .zip or the single .exe from the release page. No installer, no account.
- 2
Launch
Double-click WiFiHealthMonitor.exe. It starts monitoring at once.
- 3
Watch
Live data shows instantly. History and forecasts improve as data builds up.
- 4
Fix
Follow the recommendations to make your WiFi better for good.
Good to know
- If you took the .zip, extract it to any folder first.
- If Windows SmartScreen appears, click “More info”, then “Run anyway”.
- The app keeps its database in %APPDATA%\WiFiHealthMonitor\.
Built for performance. Engineered for reliability.
The details, for technical readers.
Architecture
- .NET 8.0 with WPF, native on Windows
- Service-oriented, clean separation
- Event-driven UI updates
- Full error handling and logging
Forecast engine
- ML.NET 5.0 time-series forecasting
- SSA for pattern detection
- Hybrid design for value on day one
- Retrains itself every 24 hours
Data
- SQLite, light and reliable
- Indexed queries for fast history
- One reading every 30 seconds
- About 1–2 MB of data per week
System
- Windows APIs: netsh, wmic
- Ookla Speedtest CLI
- Under 2% CPU, about 100 MB RAM
- Self-contained single-file build
Questions? Answered.
Can't find what you need? Open an issue on GitHub.
Does this slow down my internet?
No. Monitoring is passive: it only reads metrics Windows already has. Speed tests run only when you start one, or once an hour if you leave auto-tests on.
Do I need to install .NET?
No. The app is self-contained, with the .NET runtime bundled in. Download it and run it.
Is my data private?
Yes, fully. All data stays on your PC in a SQLite database. No cloud uploads, no telemetry, no tracking.
How accurate are the predictions?
Statistical mode: 30–75%. ML.NET mode: 60–85%. Accuracy depends on how consistent your network is. A more predictable network gives better forecasts.
Will this work on Mac or Linux?
Not now. The app uses Windows-only APIs such as netsh and wmic. Mac and Linux versions may come later if people ask for them.
Can I use this on Ethernet?
Not yet. The app monitors WiFi connections. Ethernet support is on the roadmap.
How much data does it collect?
Very little. One reading every 30 seconds is about 2,880 records a day. The database grows about 1–2 MB a week, and you can delete it at any time to start fresh.
What if I find a bug?
Open an issue on GitHub. The project is actively maintained, and bug reports get a quick reply.
Can I contribute?
Yes. The code is open source on GitHub, and pull requests are welcome.
Why was this built?
Frustration. The author never knew why their WiFi was slow, so they built a tool to find out, then saw that other people might want it too.
Stop living with WiFi uncertainty.
Download WiFi Health Monitor now and take control of your network.
- Open source
- Privacy-first
- Actively maintained
- Free forever
- Version
- v2.0.0
- Released
- December 2025
- Runs on
- Windows 10/11 (64-bit)
- Source code
- Open on GitHub
- Needs
- A WiFi adapter
- .NET runtime
- Bundled, nothing to install